Trackers and Cycle Detection in SimSoup
22 October 2006
I am extending SimSoup to include features that enable cyclic flows of material in the Reactor to be detected. The basic concept is to include 'Trackers' in the Reactor and monitor their path.A Tracker is an object that can be attached to a Molecule when it first enters the Reactor as part of the 'food supply'. When the Molecule takes place in an Interaction, the Tracker is passed on to one of the Interaction's Product Molecules chosen according to an arbitrary rule (if the Interaction is a Fission), or to the single Product Molecule (if the Interaction is a Transformation or Construction).
This process goes on so that as Interactions take place the Tracker is continually passed from Reactant to Product and traces a path from Molecule Type to Molecule Type. Eventually the Tracker will either stop at a particular Molecule Type that takes place in no further Interactions, or will return to a Molecule Type it has previously visited. When this happens, a Cycle has occurred. SimSoup detects Cycle Occurrences and identifies each as an instance of a particular Cycle Type.
The plot below shows initial output from SimSoup using Trackers. The scenario setup was as follows:-
- 50 Molecule Types, with integer masses ranging from 1 to 5
- 8 Maintained Molecule Types, all of mass 1. One Molecule of each maintained type is added at each timestep
- For each maintained Molecule added, there is a 1% probability that a Tracker will be attached
- Rate Constants for Constructions and Fissions chosen at random with maximum 0.05
- 10 Catalytic Transformations setup at time 50,000, with a further 10 added at each subsequent interval of 100,000 timesteps.
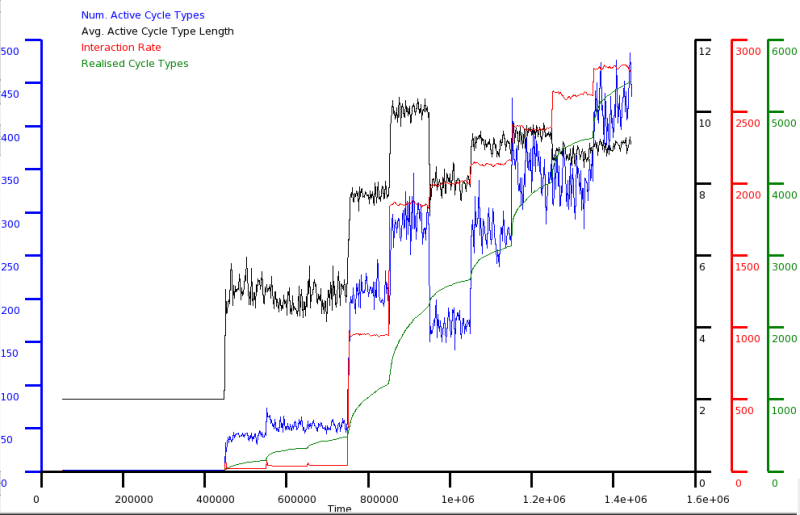
The plot shows the following:-
- Interaction Rate: Total number of Interactions in the Reactor at each timestep
- Number of Active Cycle Types: Number of different Cycle Types that occurred in the Reactor durung the latest statistics collection interval (2000 timesteps)
- Average Active Cycle Type Length: This is the average path length for each Active Cycle Type. That is, the number of steps from Molecule Type to Molecule Type before the Tracker returns to a Molecule Type it has previously visited
- Realised Cycle Types: This is the total number of Cycle Types that have occurred in the Reactor during the run.
- The number of Active Cycle Types generally increases as network connectivity increases. However, in some circumstances an increase in network connectivity can reduce the number of Active Cycle Types
- The average length of an Active Cycle also shows a general increase as network connectivity increases, but can also fall. Typically the direction of change is the same as in the case of the number of Active Cycle Types.
An Approach to Modelling Energy and Thermodynamics in SimSoup
1 May 2006
The current version of SimSoup does not include any concept of energy and thermodynamics. A SimSoup network can therefore have behaviour that would not be possible in real chemistry.I have been thinking for some while about how to represent these factors in SimSoup, and this article outlines some initial thoughts on this topic.
1 Background Concepts
This section itemises some concepts that are relevant to a discussion of energy and thermodynamics in chemical systems:-- Kinetic and Potential Energy: In any chemical reaction, a set of reactant particles (eg molecules or ions) are transformed into a different set of product particles. Although mass and energy must both be conserved in chemical systems, there is usually a transformation of energy from one form to another. Specifically, kinetic energy (usually energy of thermal motion) can be used to break chemical bonds. Such bond breaking can result in a reactant particle breaking up into smaller product particles. In such cases, the kinetic energy is used to do work against the forces holding the reactant particle together, resulting in an increase in the potential energy of the system.
Potential energy is energy associated with a system's configuration, and is measured by reference to some alternative configuration of the system. For example, if a spring starts from its unstretched state and is then stretched, the work done in stretching it is converted to potential energy. This potential energy can be released if the spring is allowed to return to its unstretched state. Similarly, if two oppositely charged particles are moved apart from an initial position, the system acquires potential energy that can be released if the particles move back to their initial configuration.
A molecule or ion of a particular species has a defined potential energy. When a reaction event takes place, the energy released or absorbed is the difference between the potential energy of the reactants of the products.
- Reaction Profile Any chemical reaction event has a reaction profile that shows how potential energy varies as the reaction progresses.
 A Reaction Profile
The figure above shows an example reaction profile. The reaction coordinate represents the configuration and motion of the participants in the reaction. On the left hand side of the figure, the reaction coordinate represents a situation in which Reactants are about to interact. On the right hand side of the diagram, the reaction coordinate represents a situation in which Products have just been formed by a reaction event.
The figure shows that the Reactants initially have a potential energy Vr, and that as the reaction progresses the potential energy increases until it reaches a maximum value, after which the potential energy decreases until it reaches a value Vp associated with the products.
The configuration that corresponds to the region close to the maximum is called the activated complex. The difference between the initial potential energy of the reactants (Vr), and the maximum in potential energy associated with the activated complex is known as the activation energy, Ea. The activation energy is the minimum kinetic energy that the reactants must have in order to form products.
-
Rate Constant and Molecularity: The Rate Constant, k, for a reaction determines the rate of the reaction. In a unimolecular reaction, in which there is a single reactant species, A, the total rate of the reaction is:-
reaction rate = k [A],where [A] is the concentration of species A.
In a bimolecular reaction in which there are two reactant species, B and C, the total rate of the reaction is:-
reaction rate = k [B][C]. -
Entropy: I can best summarise this by quoting from Frank Lambert (also quoted in the 'Quotes' section of this website):-
Entropy is not disorder. Entropy is not a measure of disorder or chaos. Entropy is not a driving force. Energy's diffusion, dissipation, or dispersion in a final state compared to an initial state is the driving force in chemistry. Entropy is the index of that dispersal within a system and between the system and its surroundings
2 The Arrenhius Parameters and their Physical Interpretation
It is found experimentally that many chemical reactions have a rate constant that varies with temperature according an equation of the following form:-
where T is temperature, and R is the gas constant.
The relationship holds for both unimolecular reactions and bimolecular reactions, and for reactions taking place both in gases and in solutions.
We can interpret the exponential factor e-Ea/RT as the fraction of potential reaction events in which sufficient kinetic energy is available to overcome the activation energy, Ea.
In the case of a reaction taking place between two molecules in the gas phase, e-Ea/RT is given by the Boltzmann distribution as the fraction of collisions with a kinetic energy in excess of Ea. This kinetic energy would be derived from the thermal motion of the two reactant molecules. In the case of a liquid phase reaction taking place in a solution, some or all of the kinetic energy would be derived from kinetic energy of the solvent molecules.
The 'pre-exponential' factor, A, can be interpreted as the frequency of potential reaction events. In the case of a gas phase reaction between two colliding molecules, two factors affect this frequency:-
- Frequency of Collision Events: This is the frequency of events in which two molecules approach one another closely enough to react
- Steric Factor: In some cases, a close approach of two molecules is not sufficient for a reaction, they must also approach each each other with the right orientation. In such cases it is said that the reaction has a steric requirement.
3 The Arrenhius Equation and Thermodynamics
The behaviour of a chemical network is determined by the possible reactions that can take place, and by the rate constants for these reactions. The discussion of the Arrenhius Equation above shows that rate constants are not arbitrary; they depend on the following factors:-- The Activation Energy for the reaction
- Frequency of potential reaction events
- Steric requirements for the reaction.
Suppose that the activation energy for the reverse reaction is greater than for the forward reaction (as is the case in the reaction profile diagram above, in which the potential energy of the products is less than that of the reactants).
In this situation, the exponential factor e-Ea/RT will be larger for the forward reaction than for the reverse reaction. If the conditions determining the pre-exponential factor, A, are such that A has the same value for both the forward and reverse reactions, then the rate constant for the forward reaction will be greater than that for the reverse reaction.
This reflects the fact that it is easier for a molecule of X to acquire the activation energy for the forward reaction than for a molecule of Y to acquire the higher activation energy required for the reverse reaction.
It is not necessarily the case that a reversible reaction always prefers the direction that results in lower potential energy. For example, consider the following bimolecular reaction:-
Suppose that there is a very stringent steric requirement for the forward reaction such that the C and D molecules must approach each other with a very specific orientation, but that there is no similar requirement for the reverse reaction. This would lead to a situation in which the pre-exponential factor for the forward reaction is very low. As a result of this, the rate constant for the reverse reaction can be higher than that for the forward reaction, even if the activation energy for the reverse reaction is higher.
This can be understood in terms of an activation entropy component in the pre-exponential part of the Arrenhuis equation. In the bimolecular example above, the requirement for two previously separated molecules to combine (with a stringent steric requirement) into a single molecule means that the single E molecule has a lower entropy than the two separated C and D molecules. This can outweigh the exponential factor e-Ea/RT that would favour the forward reaction.
We can conclude therefore that the rate constants of reactions between molecular species in chemical networks are determined by thermodynamic factors including the activation energy and activation entropy, and that the Arrenhius equation is a reflection of the operation of these factors.
4 Energy and Rate Constants in SimSoup
In the current version of SimSoup, there are no constraints on the way that Molecule Types can be connected by Interaction Types, or on the way rate constants are set. SimSoup networks therefore ignore the thermodynamic principles that are embodied in the Arrenhius equation.To incorporate thermodynamic principles into SimSoup, the following enhancements are planned:-
- Assign a potential energy to each Molecule Type
- Assign an activation energy to each Interaction Type
- Setup Interaction Types in pairs, each pair consisting of a forward Interaction Type and a reverse Interaction Type. The forward and reverse activation energies are set such that the activated complex has the same potential energy regardless of the direction of the interaction.
- For each Interaction Type, set a value for the pre-exponential factor broadly consistent with the range of values observed in real chemistry, and...
- Set the exponential factor (e-Ea/RT) according to the activation energy and a temperature assigned to the Reactor.
SimSoup Network shows Oscillating Behaviour
16 April 2006
The new version of SimSoup released earlier today includes a built-in scenario that shows oscillating behaviour in the Reactor as the simulation runs. The plot below shows the number of Molecules, the total Interaction Rate, and the number of Molecule Types existing in the Reactor plotted against time for the Oscillator scenario.It can be seen that peaks in the indicators are occurring at intervals of (roughly) 200,000 timeteps.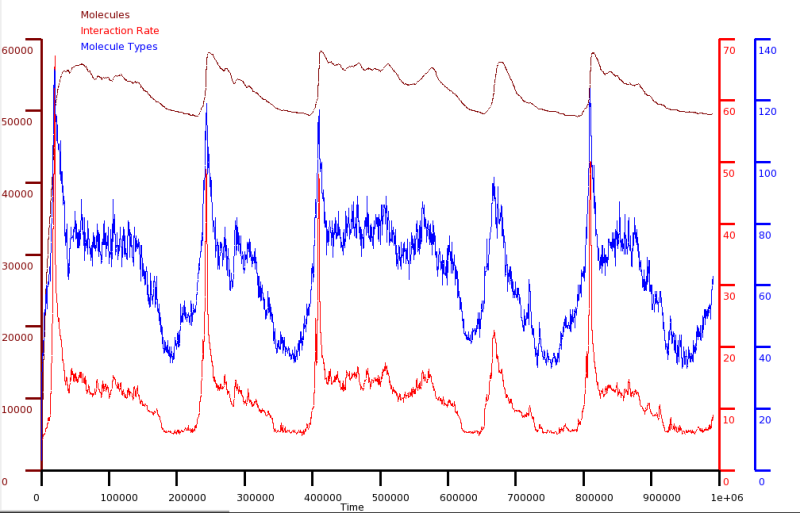
The Manhattan Plot below shows the variability in the Reactor Composition at different times. The Reactor Composition is defined by the number of Molecules of each type present in the Reactor. In other words, the Reactor Composition represents the 'mix' of Molecule Types present.
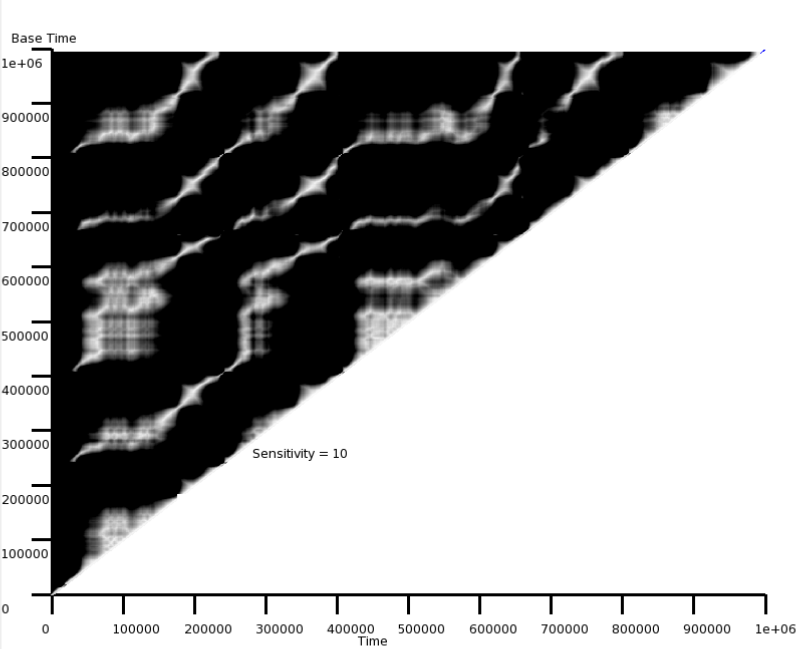
The most straightforward way to read the Manhattan Plot is horizontally from left to right. The point at the far right of each 'row' corresponds to the Reactor Composition at a particular time (the 'Base Time'). Points to the left correspond to the Reactor Composition at earlier times, with the darkness of each point indicating the degree of difference from the Reactor Composition at the Base Time. A light coloured point therefore indicates a time at which the Reactor Composition was close to that at the (later) Base Time.
The striking diagonal pattern indicates that the Reactor Composition is behaving cyclically. Following any horizontal line across the plot, we see that most of the path is black, but that it turns white for a short period at intervals of approximately 200,000 timesteps. The white sections along the line indicate periods during which the system had (almost) the same Reactor Composition.
In short, the Reactor Composition is constantly changing, but the system returns periodically to the same Reactor Composition. In other words, the system has an oscillating behaviour.
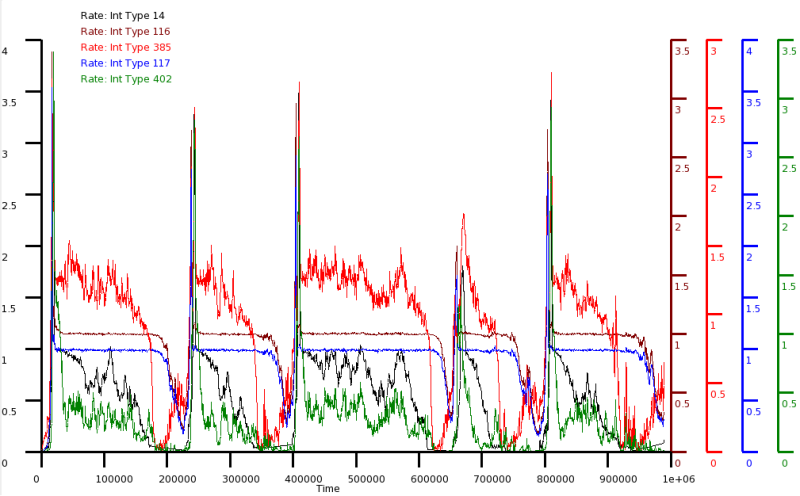
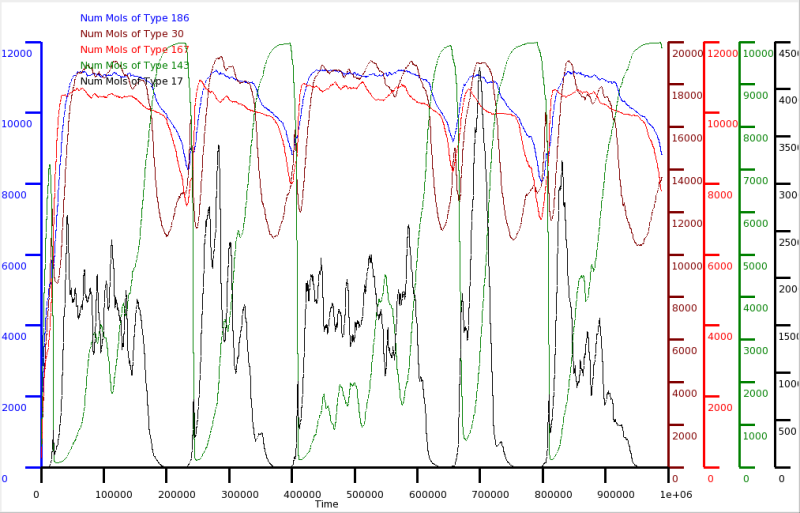
The two plots below show details of the behaviour in the Reactor. The first of the two shows rates of specific Interaction Types, and the second shows the numbers of specific Molecule Types in the Reactor as the simulation proceeds.
It can be seen that there are large variations, with 'spikes' occurring in the Interation Rates.
SimSoup 0.3 Released: Includes ' Manhattan Plot' Providing Visibility of the Overall Variability of Reactor Composition
16 April 2006
Version 0.3 of SimSoup has been released today. The main additional features are :-- Manhattan Plot: This shows the variability in the composition of the material in the Reactor
- More Simulation Control Facilities, including 'Action Requests' enabling the user to control the simulation (eg by adding Molecules during a simulation run)
- Predefined scenarios showing oscillating, variable, and steady behaviour
- Enhanced user interface based on the GTK2 GUI toolkit