Introduction
Overall functionality of SimSoup is described in the paper "SimSoup: An Artifical Chemistry Model for Investigation of the Evolution of Metabolic Networks" available in the Publications section of this website.Manhattan Distance and the Manhattan Plot
The concept of Manhattan Distance and the Manhattan Plot have been introduced to SimSoup since the publication of the paper mentioned above, and are described below.Instantaneous and Persistent Network States
At any point in time, a SimSoup network has an Instantaneous State. This is defined by:-- The Static Model: The set of pre-defined Molecule Types and Interaction Types, and...
- The Reactor Composition: This is defined by the number of Molecules of each type present in the Reactor. This can be expressed as a vector R. Each element of R corresponds to the (integer) number of Molecules of a particular type present in the Reactor.
If R(t) is constant, or is following some repeating pattern, then we can say that the Reactor is in a Persistent State. The following questions arise in regard to Persistent States:-
- How can we recognise that the Reactor is in a Persistent State?
- How can we distinguish one Persistent State from another?
Manhattan Distance
Both of these questions can be answered to some extent by measuring the Manhattan Distance between different Instantaneous States. Manhattan Distance between two points in a Euclidean space is defined as the sum of the (absolute) differences of their coordinates.
For example, in a plane, the Manhattan distance between the point P1 with coordinates (x1, y1) and the point P2 at (x2, y2) is
The Manhattan Distance between two points is not dependent on the route taken. This is illustrated in the figure below; the three routes, a, b and c between P1 and P2 have the same length.

where the summation is over all Molecule Types, and r1i, r2i are the ith elements of R1 and R2. For example, if we have a Reactor in which a Fission Interaction, A &rarr B + C, takes place, then the Manhattan Distance between the Reactor Compositions before and after the Interaction is 3. If a Construction, B +C &rarr D, then takes place, the Manhattan Distance from the original state before the Fission is now 2.
Recognising and Discriminating between Persistent States
If the Manhattan Distance between two Reactor Compositions R(t1) and R(t2) at times t1 and t2 is zero, this indicates that R(t1) and R(t2) are identical.If we monitor the Manhattan Distances between Reactor Compositions at different times and find a period during which all of the distances are zero, we can therefore say that the Reactor is in a Persistent State.
It would be unduly restrictive to insist that subsequent states must be identical, and so we can identify a tolerance Manhattan Distance, Dtol, and say that the Reactor is in a Persistent State during a period if the Manhattan Distance between any two Reactor Compositions during the period is no greater than Dtol.
Reducing Dtol can be regarded as increasing the sensitivity to differences between compositions. A series of Reactor Compositions that are regarded as a single Persistent State when a particular value of Dtol is used may be separated out into different states if the value of Dtol is reduced.
It is possible that R(t) varies cyclically, such that it traverses a large region in the space of possible compositions, but returns periodically to a composition that is close to (ie within Dtol of) the original composition. This situation can also be regarded as a Persistent State.
The Manhattan Plot in SimSoup
In order to provide a mechanism enabling recognition and discrimination of Persistent States, a 'Manhattan Plot' facility has been added to SimSoup.
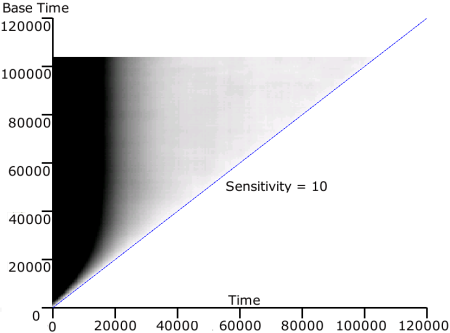
An example plot is included in the figure above. Each point on the triangular plot indicates the normalised Manhattan Distance between Reactor Compositions at times 'Base Time' (y axis) and 'Time' (x axis). A light tone signifies a low distance between the two Instantaneous States. Darker tones signify larger distances.
Two light toned points along a horizontal section have similar Reactor Compositions. 'Sensitivity' determines the darkness of the display for a particular distance. Increasing Sensitivity increases the darkness for a particular value of Manhattan Distance. At Sensitivity = 10, the plot has maximum darkness for any distance above one tenth of the maximum possible distance Dmax, where Dmax is calculated as twice the number of Molecules in the Reactor at 'Base Time'.
The plot can be read as follows. The point Base Time = 100,000, Time = 90,000 (towards the top right of the plot) is light grey. This signifies that the Reactor Compositions at these two times are close. Following a horizontal line leftwards from this point, we see that the plot remains light grey until about Time = 30,000. This signifies that at all times between 30,000 and 90,000, the Reactor Composition was close to that at Time = 100,000. Similarly, if we follow the plot to the right, we can see that at times between 90,000 and 100,000, the Reactor Composition was also close to that at time 100,000.
In short, after time 30,000 the Reactor is in a Persistent State in which the Reactor Composition varies only slightly.
Tracing leftwards beyond Time = 30,000, the plot becomes increasingly dark. This signifies that at these times the Reactor Composition was substantially different to that at Time = 100,000.
Note that while a horizontal line of light tone indicates a (roughly) constant Reactor Composition, a horizontal line of black does not indicate constant state; it simply signifies that the Reactor Compositions re substantially different to that at the Base Time. They may or may not be similar to each other.
In the example plot above, the Reactor Composition is in fact in a considerable state of flux during the period up to Time = 30,000. This can be seen by focusing on the horizontals for Base Time = 30,000 and earlier (bottom left of the figure). These horizontals are black except for all but the latest Times (those that are close to the diagonal). This indicates that whatever Base Time we choose during this period, its Reactor Composition is substantially different to that for earlier times.